 The question
Could our roof space make a great computer room? That was the big question. Moving my network points, file server, router, security DVR and some other bits up into the roof would tidy up the study and reduce noise and heat in there too. But would it get too hot up there for electronics to survive?
In 2011, our roof underwent a significant renovation. The roof structure was braced, the tiles were replaced, and we put in a big effort to clean up 90 years of accumulated dust, muck and messy wiring. New insulation was put in and sarking (foil) was installed between the batons and tiles, improving weatherproofing and insulation. So the roof space should have been quite well insulated compared to leaky mess that it used to be. The only way to know for sure whether the equipment would cook, was to collect hard data on the temperature up there.
The process
Arduino to the rescue! Arduino is a low-cost, open-source computing device that can easily be connected to sensors, motors and all sorts of things — perfect for rapid prototyping.
With two digital temperature sensors and a network connection attached, I had Arduino take simultaneous temperature readings from both the study and the roof space at regular intervals and then save them on my web site to be recalled and graphed later.
The answer
After 3 months and some 24,000 saved temperature readings, it was clear that it’s too hot up there for anything passively cooled. During the monitoring period, we didn’t have any of those truly hot Melbourne summer days, but the roof space easily got up above 45 degrees C — around 10 degrees warmer than the ambient temperature. So on a properly hot day, it would easily hit in excess of 50 degrees up there.
I probably should have also recorded ambient temperature (say, from the Bureau of Meteorology) while running this trial. However, given that the computer equipment was already running in the study I decided it wasn’t terribly important to monitor the outside temperature — though it would have been interesting to see the how external temperatures affect room temperature inside.
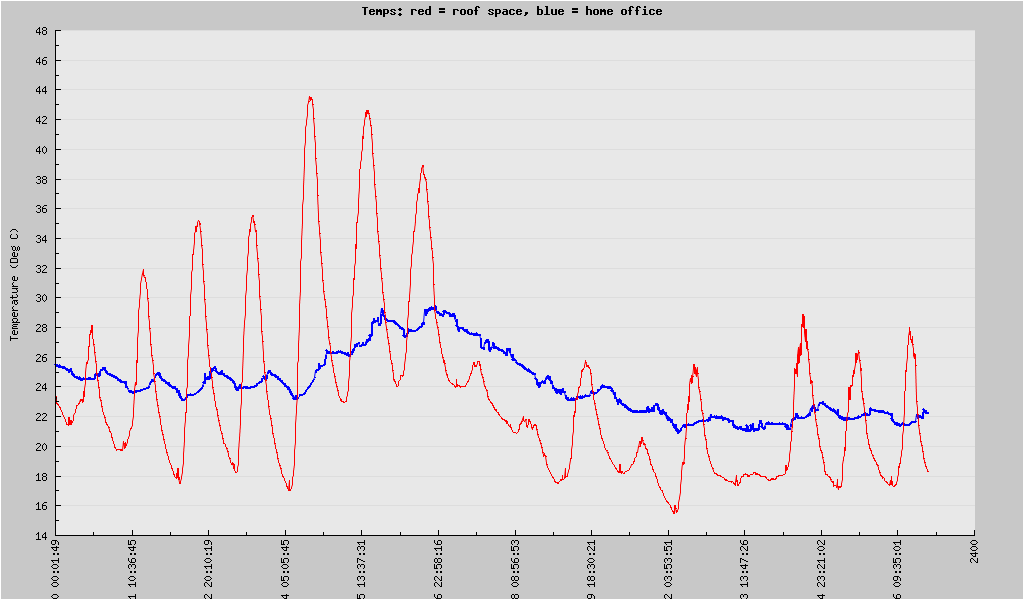
The graph above shows the temperatures in the study (blue line) and in the roof space (red line) between 20 February and 6 March — one of the warmest periods the Arduino recorded. Regarding this graph:
- The maximum temperature in the roof increased for the first few days as each day grew a little hotter than the previous one
- The inside temperature started climbing after the 5th day — the house’s brickwork couldn’t absorb any more heat and had started radiating it inside
- Two successive cooler days were enough for the study temperature (and bricks) to return to normal
- Maximum study temperature was around 29 degrees C on 27 February, maximum roof temperature was around 43 on 25 February (Melbourne’s high that day was 36).
So, while the idea of moving the equipment out of the study had merit, the temperature readings prove that the roof space is not the place for it. I would need either a source of cooler air ducted to the equipment (and circulated by fans) or active cooling … and that’s probably going a little too far. 😉
Here is the follow-up post, outlining the technical elements of this project, such as Arduino code, the type of sensors and so on.


Nice bit of work. I guess one positive thing the graph illustrates is how much cooler the study was compared to the roof space. The new insulation and sarking were worth it.
Pingback: Taking the house’s temperature — engineering edition | Testing 01, 10